

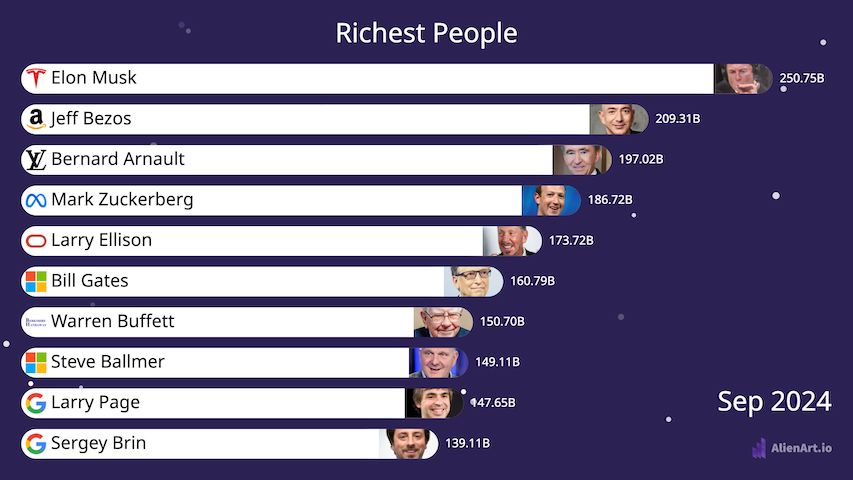
1. AlienArt.io
- Description: Alien Art is a tool for creating data visualizations and creative presentations. Focused on visual storytelling in a video format.
- Notable Features:
- Ability to compile multiple chats in a single video via layers.
- Ready-to-use templates.
- Video: Allows to export a project in a video format directly from the tool.
- Mobile Device Support: Videos can be made end-to-end on a mobile device
- Requirements: Web-browser
- Pricing: The free version allows monthly export of up to 30 minutes of videos. The paid version costs $19/month and gives unlimited exports.
- Best For: Creating content for social media.
2. Flourish
- Description: Flourish is a powerful tool for creating interactive and animated data visualizations, including bar chart races.
- Notable Features:
- Ready-made templates for bar chart races.
- Fully customizable with options to tweak design and animations.
- Projects can be connected to Canva.
- Video export: This can be done by making the project full-screen and screen-recoding.
- Mobile Device Support: Projects can be made on mobile devices, but recording a video in good quality will require a desktop device.
- Requirements: A web browser and a screen-recoding tool.
- Pricing: Free for individuals.
- Best For: Beginners and professionals aiming for visually striking, interactive charts.
3. Bar Chart Race Tool by Fabdevgit
- Description: A lightweight, open-source tool for generating animated bar chart races using a simple web interface.
- Notable Features:
- Upload CSV files for data input.
- Customize animation speed, colors, and labels.
- Outputs a downloadable video or GIF.
- Video export: This can be done by making the project full-screen and screen-recoding.
- Mobile Device Support: Projects can be made on mobile devices, but recording a video in good quality will require a desktop device.
- Requirements: A web browser and a screen-recoding tool.
- Pricing: Free and open-source
- Best For: Quick, no-frills bar chart race creation without needing an account or advanced skills.
4. Zoho Sheet Race Charts
- Description: Part of Zoho Sheet, a cloud-based spreadsheet tool offering race charts as a built-in visualization option.
- Notable Features:
- Seamless integration with Zoho spreadsheet data.
- Simple animations for bar chart races.
- Easy sharing and embedding within Zoho's ecosystem.
- Video Export: This can be done by making the project full-screen and screen-recoding.
- Mobile Device Support: Projects can be completed in the browser or the mobile app, but screen recording in the best quality will require a desktop device.
- Requirements: A web browser or mobile phone, a screen-recoding tool, and Zoho Sheets.
- Pricing: Has a free version.
- Best For: Users already familiar with Zoho's suite of productivity tools.
5. Living Charts
- Description: A platform focused on dynamic, animated charts for engaging storytelling, including bar chart races.
- Notable Features:
- Simple and straightforward
- User-friendly interface for uploading data and generating charts.
- Mobile Device Support: Projects can be completed in the browser, but screen recording in the best quality will require a desktop device.
- Requirements: A web browser and a screen-recoding tool.
- Pricing: Free up to 10 projects, then $19/month.
- Best For: Creating simple data visualizations.
6. Bar Chart Race Visual for Microsoft Power BI
- Description: A custom visual for Microsoft Power BI enabling users to create bar chart races within dashboards.
- Notable Features:
- Integration with Power BI datasets.
- Interactive animations within reports and dashboards.
- Customizable themes and styles.
- Mobile Device Support: Projects can be completed in the browser, but screen recording in the best quality will require a desktop device.
- Requirements: A web browser and screen-recording tool.
- Pricing: has a free version.
- Best For: Professionals using Power BI for business analytics and presentations.
7. Bar Chart Race Extension for Tableau
- Description: An add-on available through the Tableau Exchange, enabling bar chart race animations for Tableau dashboards.
- Notable Features:
- Seamless integration with Tableau's visualization environment.
- High customization for animation settings and appearance.
- Outputs interactive dashboards or shareable videos.
- Mobile Device Support: Projects can be completed in the browser, but screen recording in the best quality will require a desktop device.
- Requirements: A web browser and screen-recording tool.
- Pricing: has a free version.
- Best For: Data analysts and Tableau users looking to add dynamic storytelling elements to their visualizations.