

Animated Chart Visualizations
Pick a chart format to dive into a complete guide — live example, ready-made templates, and a step-by-step how-to. Every chart type works from a CSV, Excel, or Wikipedia table and exports as MP4 video.
Animated Chart Makers
Full chart-type guides with live examples, templates, and how-to walkthroughs.
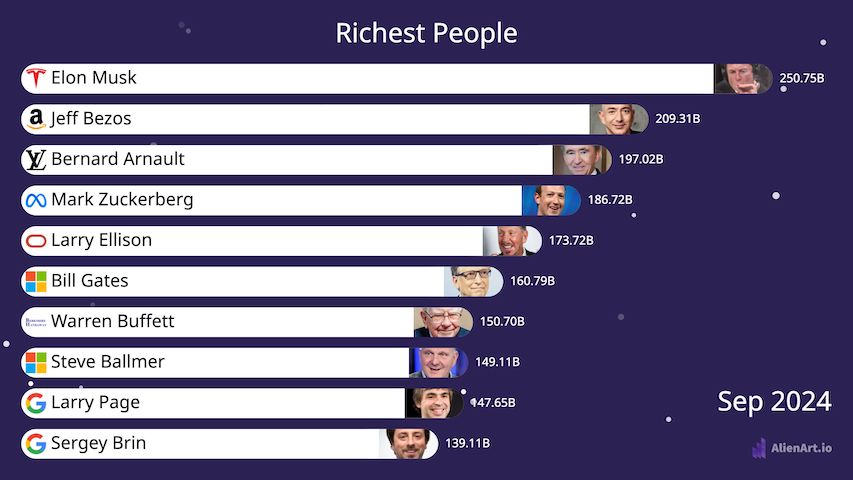
Bar Chart Race
Animated horizontal bars that grow, shrink, and reorder over time. The most popular format for showing how rankings change — richest people, country GDPs, top YouTube channels, crypto market caps.
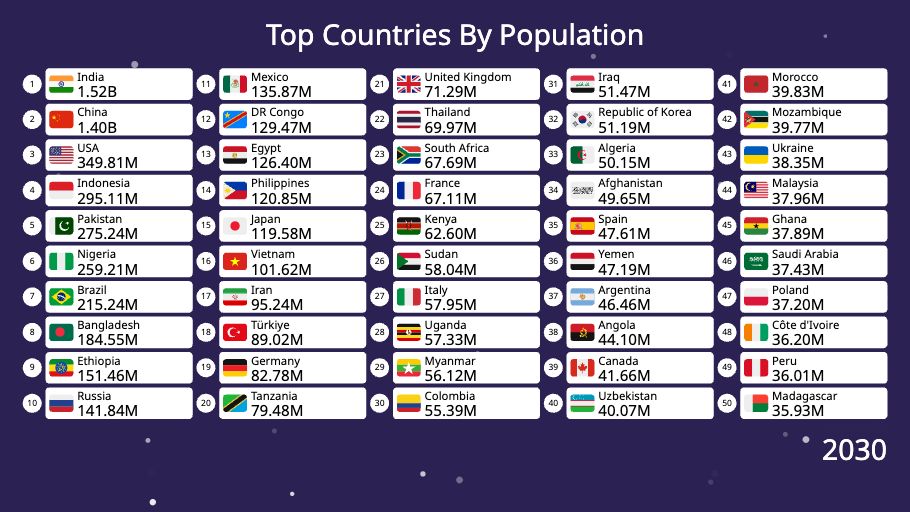
Table Chart Race
Animated ranking tables with multiple numeric columns per row, optional logos and flags. Perfect for sports standings, financial scoreboards, and product leaderboards where more than one number per row matters.
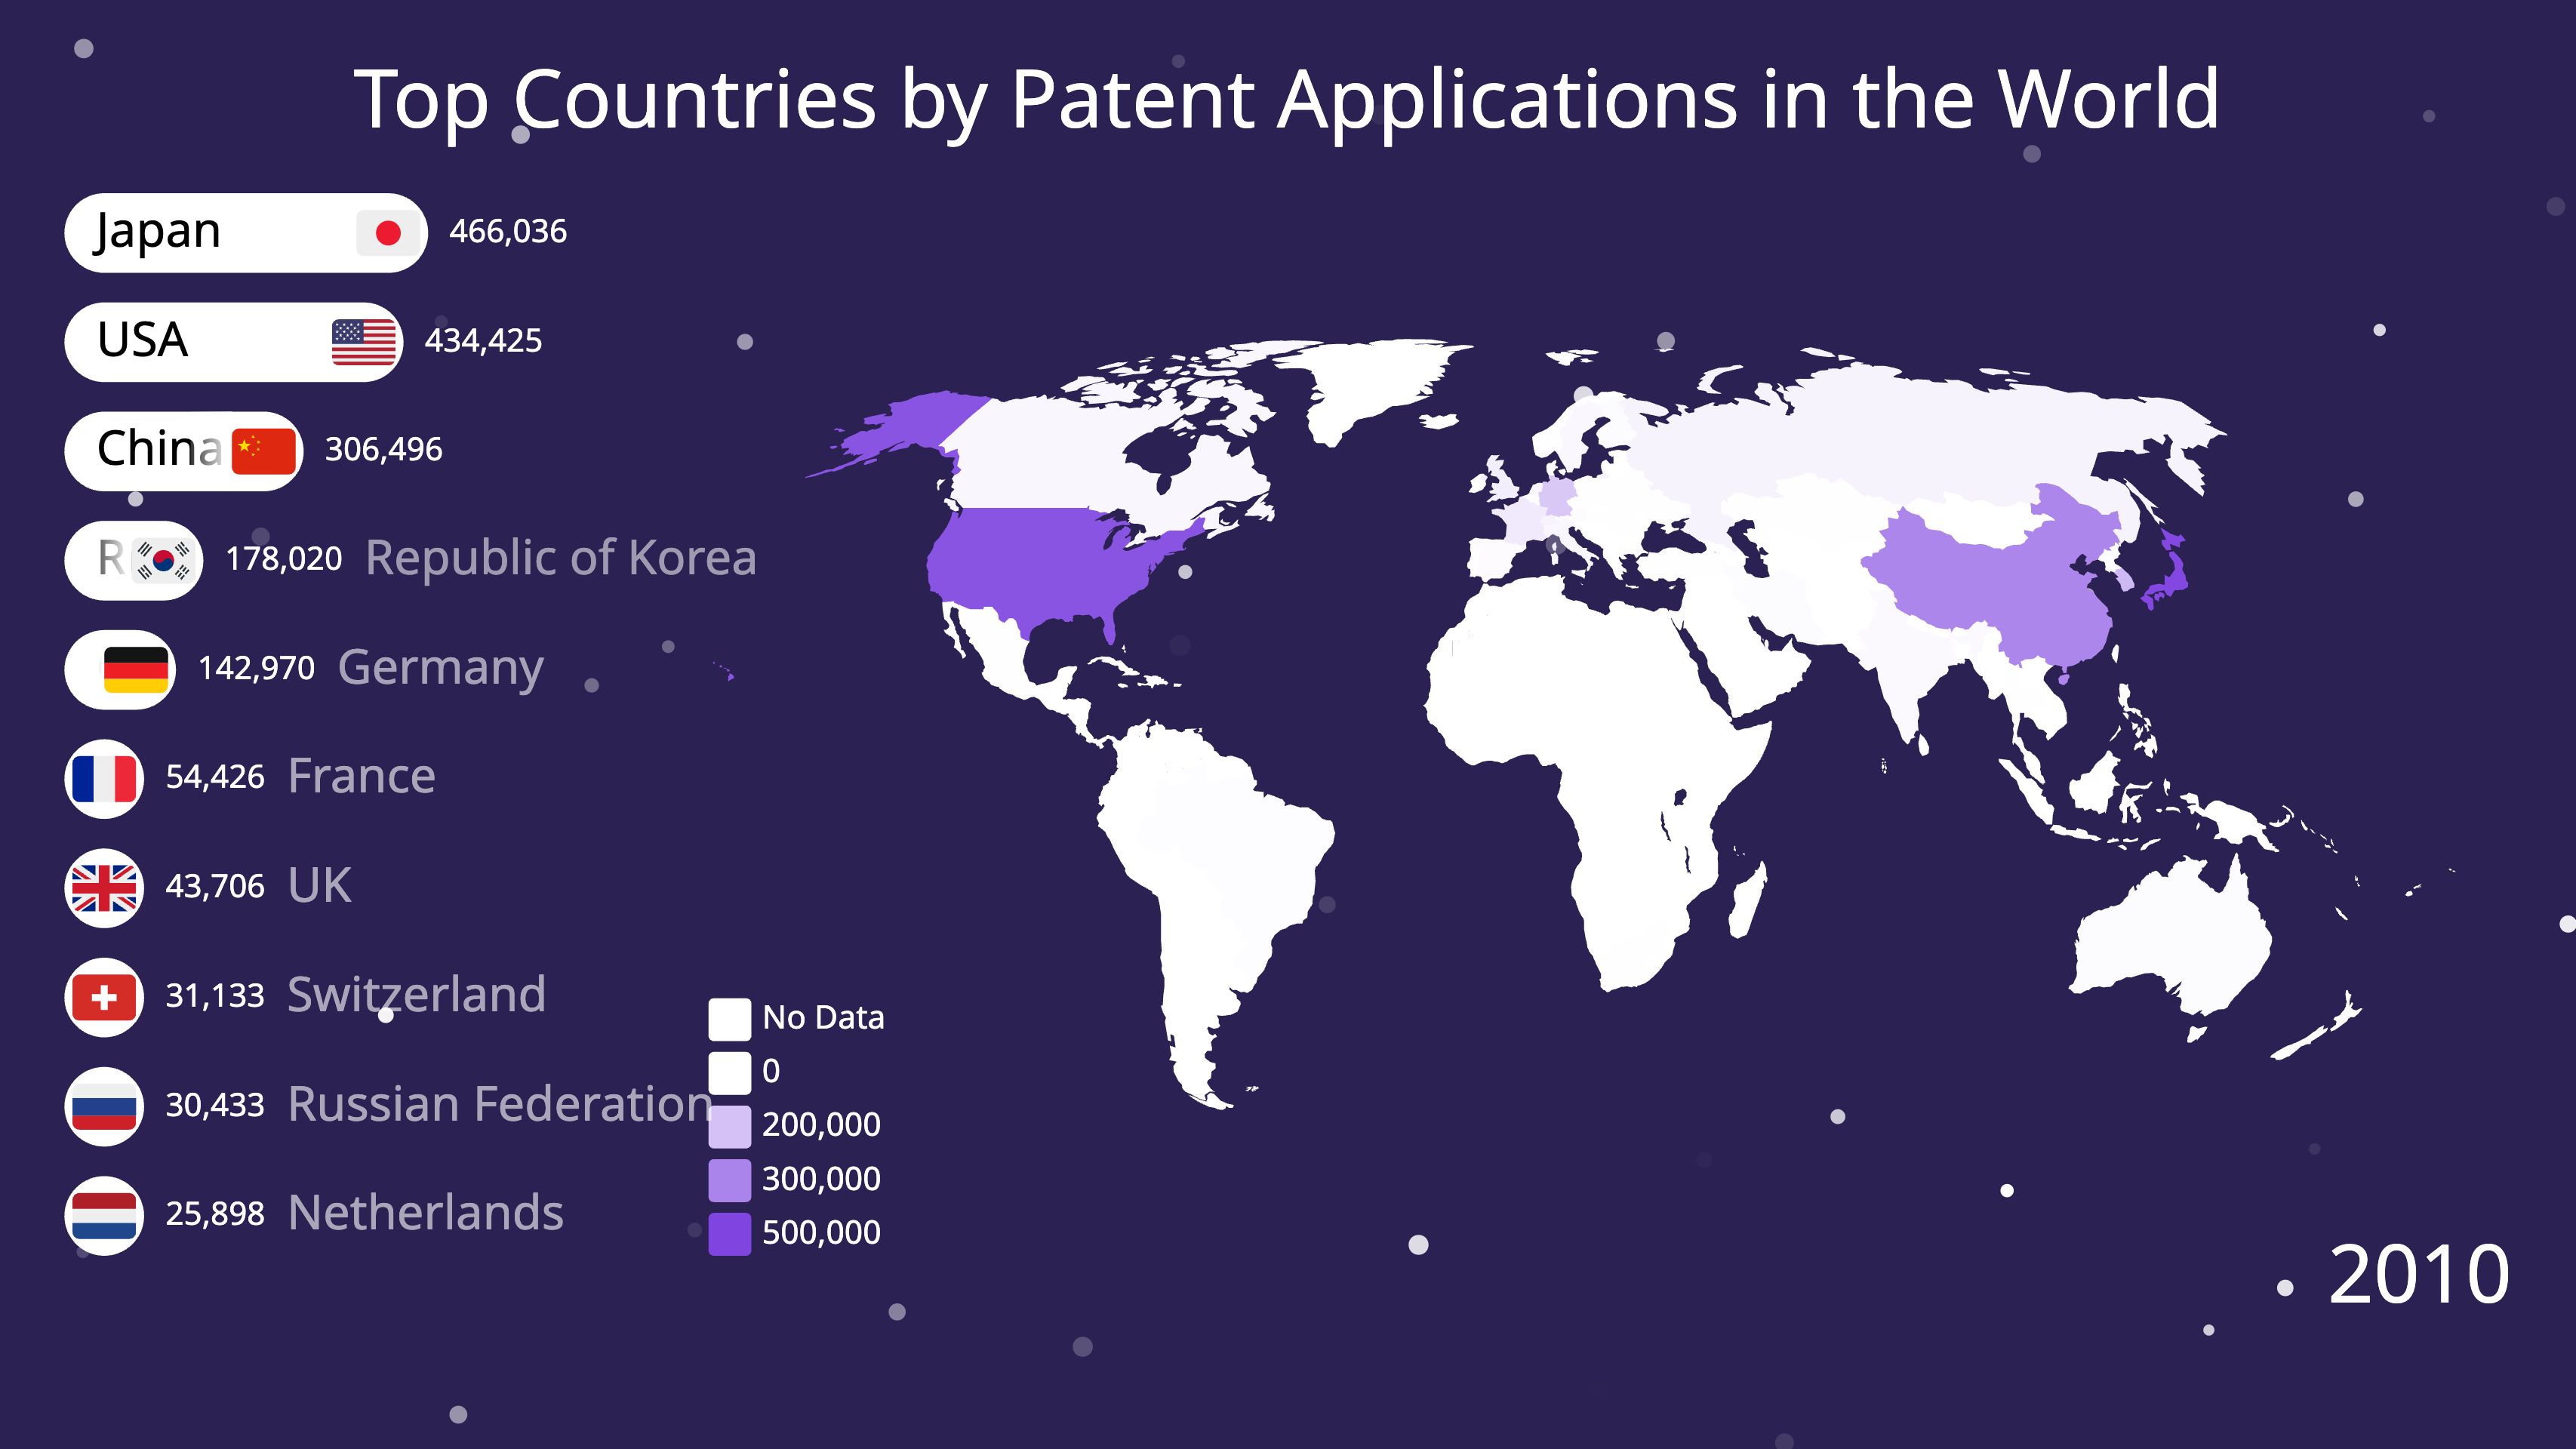
Map Chart Race
Animated world maps where countries change color and intensity over time. Pair with a bar chart race or table to show ranked values alongside the geographic view — patents, GDP, emissions, populations.
More Animated Chart Types
Already supported in the editor — full guides launching soon.
Line Chart Race
Multiple lines drawn over time, revealing trends, crossovers, and breakouts.
Tornado Chart Race
Two-sided horizontal bar race for win-loss records, age pyramids, and before-vs-after.
Comparison Chart
Side-by-side animated comparison of two or more entities — products, players, countries, plans.
Slideshow
Sequenced image and text slides for explainers, recaps, and listicles.
Why Animate Your Charts?
A static chart shows you what is. An animated chart shows you what changed — and that’s the part viewers actually watch.
Animated charts turn ordinary spreadsheets into stories. The drama of one team passing another, one company overtaking its rivals, or one country’s economy outgrowing the next is what makes data go viral on YouTube, TikTok, X, and LinkedIn. Every visualization on Alien Art is built video-first — smooth 60fps MP4 export with full control over fonts, colors, and motion is the core product, not an afterthought.
Each guide on this page walks you through the format end-to-end: a working live example, ready-made templates to clone, a 3-step how-to, and the data structure you need. No coding, no install, no Python — just upload your CSV and pick a style.
Start With Any Chart Type
Free to start. No install. Pick a format above and have a share-ready video in minutes.