

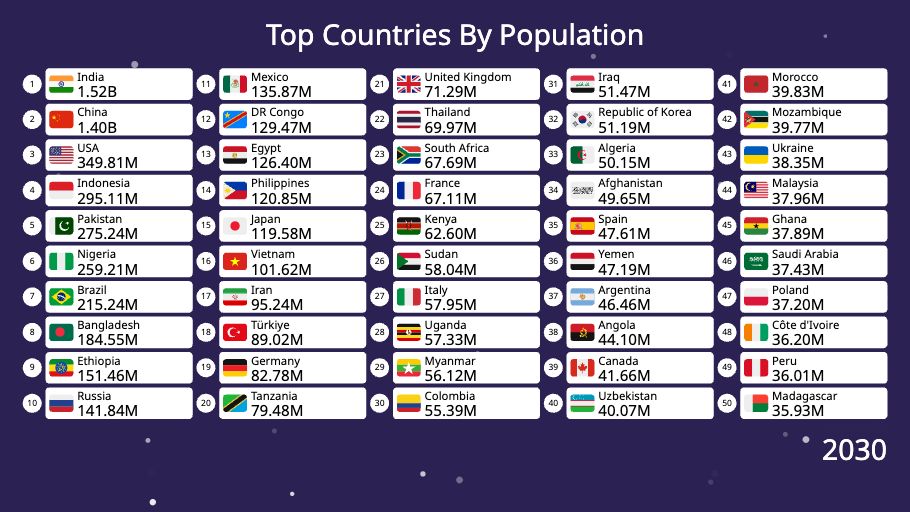
Flourish is one of the best interactive data visualization tools available, and for a lot of work it is the right answer. But there is one specific place it stops short: getting an animated chart out as a video file. If you are making content for YouTube, TikTok, Instagram, or LinkedIn, that is the one thing you need most.
This guide covers the strongest Flourish alternatives for animated data visualizations, what each one is actually good at, and how to pick based on what you are trying to produce.
Why people look for a Flourish alternative
Flourish's own pricing page sets out what each plan can export:
- Free and Presenter: image export only (PNG, JPEG, SVG)
- Publisher: image and HTML
- Enterprise: image, HTML, and video
So on every plan below Enterprise, an animated chart is an interactive embed, not a video file. To get an MP4 for a video edit, the usual workaround is to open the visualization full-screen and screen-record it. That works, but it introduces the problems screen recording always introduces: you are limited to your monitor's resolution and frame rate, you can pick up dropped frames or cursor movement, and you have to redo the whole recording every time the data changes.
The other common reasons to look elsewhere:
- Vertical video. Social platforms want 9:16. Flourish templates are built for landscape web embeds.
- Attribution on the free plan. Free projects are public and carry Flourish branding.
- Repeatable output. If you publish the same chart monthly with new data, re-recording by hand does not scale.
If none of those apply to you, Flourish is genuinely excellent and you should keep using it. If one or more do, read on.
The alternatives
1. Alien Art Charts
Best for: creators who need a finished video file, not an embed.
Alien Art is built around video output rather than web embeds. You import a CSV, XLSX, Wikipedia table, or pasted data, choose a chart type, and export an MP4 straight from the browser. There is no screen recording step, so the output is not tied to your monitor and does not pick up dropped frames or stray cursor movement.
- Chart types: bar chart race, line chart race, pie chart race, table chart race, animated maps, tornado and comparison charts.
- Video export: direct MP4. Free plan covers 30 minutes of exports a month at up to Full HD/30 FPS with a watermark; the paid plan removes the watermark and raises the ceiling to 4K/60 FPS.
- Aspect ratios: configurable, including vertical for short-form social video.
- Layers: multiple charts, text, images, and audio can be composed into one video.
- Requirements: a web browser. Projects can be built end to end on mobile.
Where Flourish is better: interactive embeds for a website, scrollytelling, and its much larger library of static and statistical chart templates.
2. Datawrapper
Best for: newsroom-quality static charts and maps.
Datawrapper is the tool most often named alongside Flourish, and it is a serious piece of software with excellent typographic defaults and accessibility handling. It is worth being clear about scope, though: Datawrapper is focused on static and interactive charts, not animation. It is a great Flourish replacement for charts, tables, and choropleth maps — but if the thing you need is an animated race video, this is not the tool for that job.
- Video export: none. PNG, SVG, and PDF export, plus interactive embeds.
- Pricing: free tier available; paid plans add custom themes and PDF/SVG export.
3. Visme
Best for: presentations and infographics where a chart is one element among many.
Visme is a broad design platform — presentations, infographics, documents — with charting built in. Its animation is presentation-style (objects entering, building, transitioning) rather than data-driven racing, so it suits a slide or a marketing infographic more than a data storytelling video.
- Video export: yes, projects can be exported as MP4 on paid plans.
- Pricing: limited free plan; paid plans unlock downloads and branding controls.
4. Vizzu
Best for: developers who want animated charts in code.
Vizzu is an open-source JavaScript library for animated data visualization, with a Python wrapper as well. Transitions between chart states are its whole design premise, so the animation quality is high. It is a library, not an app: you are writing code, and getting a video out means rendering the canvas yourself or screen-recording it.
- Video export: not built in.
- Pricing: free and open source.
5. Canva
Best for: teams already designing their social posts in Canva.
Canva is not a data visualization tool in the sense Flourish is, but it belongs on this list for one reason: it exports MP4 on every plan, including the free one. If what you want from Flourish is a chart in a video and your charts are simple, Canva may already be installed across your team.
The trade-off is real, though. Charts in Canva are design objects, so the animation is entrance and transition effects applied to a finished chart, not movement driven by the data itself. There is no bar chart race here. For a single well-branded chart in a social post it is more than enough; for time-series storytelling it is the wrong shape of tool.
- Video export: MP4, 1080p on the free plan and up to 4K on Pro.
- Pricing: generous free plan; Pro adds 4K export and brand kits.
6. Infogram
Best for: marketing teams producing infographics and reports.
Infogram covers charts, infographics, reports, and dashboards, with object-level animation (fade, slide, zoom) and video export on higher tiers. Like Visme, the animation is presentational rather than data-driven.
- Video export: available on paid plans (MP4/GIF).
- Pricing: free tier with public projects; paid plans add downloads and branding.
Quick comparison
| Tool | Direct video export | Animation style | Free tier |
|---|---|---|---|
| Flourish | Enterprise plan only | Data-driven | Yes, public + attribution |
| Alien Art Charts | Yes, MP4 from browser | Data-driven | Yes, 30 min/month |
| Datawrapper | No | Static / interactive | Yes |
| Visme | Yes, paid plans | Presentation-style | Limited, no downloads |
| Canva | Yes, MP4 | Presentation-style | Yes, 1080p export |
| Vizzu | No, it is a library | Data-driven | Open source |
| Infogram | Yes, paid plans | Presentation-style | Yes, public projects |
Plan details were last checked on 11 August 2026. Export tiers change often — confirm on the vendor's own pricing page before you buy.
How to choose
Work backwards from the artifact you need:
- An MP4 for a video edit or social post — Alien Art Charts, or Flourish if you already have an Enterprise contract.
- An interactive chart embedded on a web page — stay with Flourish, or use Datawrapper.
- A static chart for an article or report — Datawrapper.
- A chart inside a slide deck or infographic — Visme or Infogram.
- A simple chart in a branded social post — Canva.
- Animated charts inside your own application — Vizzu.
The honest summary: Flourish is not a tool most people should abandon. It is a tool with one specific gap, and the gap only matters if your output is video. If it is, you want something that treats the MP4 as the product rather than as an export option behind an enterprise contract.
Frequently asked questions
Can you export a video from Flourish?
Only on the Enterprise plan. Flourish's pricing page lists export options as image for Free and Presenter, image and HTML for Publisher, and image, HTML, and video for Enterprise. On other plans, the usual approach is to play the visualization full-screen and screen-record it.
Is there a free Flourish alternative that exports video?
Alien Art Charts includes 30 minutes of video exports per month on its free plan at up to Full HD, with a watermark. Canva's free plan exports MP4 at 1080p, though its charts animate as design objects rather than from the data. Infogram and Visme offer video export on paid tiers only.
What is the best Flourish alternative for bar chart races?
For a video file, Alien Art Charts exports bar chart races directly as MP4. For an interactive embed, Flourish's own bar chart race template is still one of the best available. We compare the wider field in 10 no-code tools for creating bar chart race videos, and cover video export specifically in best animated chart video software.